Triple Count: 231661194
URI Count: 30218224
Average URI length: 52.93, Standard Deviation: 20.45
Average URI reuse: 20.97
Appeared as (ignoring literals):
S only: 1735317
P only: 1101
S and P: 38559
O only: 11794631
O and S: 16648616
P and O: 0
S, P and O: 0
O including literals: 48039661
Literal Count: 36245030
Average literal length: 76.72, Standard Deviation: 282.03
Average literal reuse: 1.69
Blank Node Count: 0
Average Blank Node reuse: 0.00
Node appearances as S, P, O, SP, PO, OS
Aggregate node reuse
Node lengths
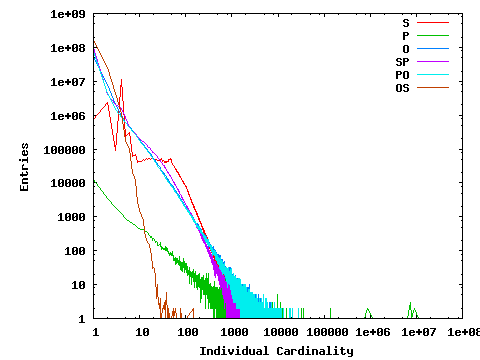
Graph 1 shows the number of times nodes (or node pairs) of a given cardinality appear. So, if there are 200,000 nodes that appear as a Subject on three occasions, then 200,000 will be plotted at an x-position of 3 on the graph.
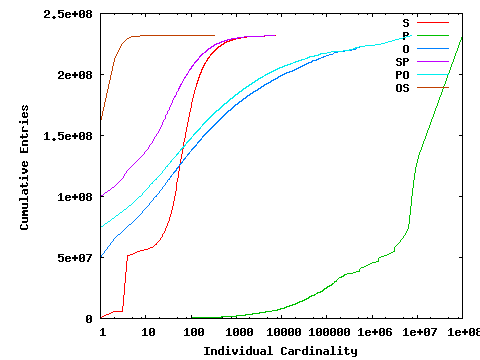
Graph 2 is more complex: it shows the cumulative entries to give a more readable graph. In this graph, if we have 100,000 nodes that appear as a Subject only once, and 100,000 nodes that appear as a Subject twice, then we plot points at (x=1,y=100,000), and (x=2,y=300,000). Thus, if a given Subject exists many times relative to the size of the dataset, it will cause a pronounced upward tick in the graph. This second graph is useful for showing the proportion of an index over S (or P, or SP, etc) that will be made up of small entries, vs large ones with repeating elements.


| Cardinality | S | P | O | SP | PO | OS |
|---|---|---|---|---|---|---|
| Total | 18422492 | 39660 | 64688277 | 112753228 | 84943262 | 192062986 |
| 1-1 | 734198 | 12899 | 49741498 | 99958311 | 74386735 | 160322033 |
| 2-2 | 2326425 | 3515 | 7773391 | 4071109 | 4390289 | 25863273 |
| 3-3 | 87910 | 1852 | 2119364 | 2125134 | 1513971 | 4433129 |
| 4-4 | 11433732 | 1220 | 1011063 | 1613126 | 881030 | 1130500 |
| 5-5 | 229739 | 901 | 615796 | 862354 | 597213 | 179579 |
| 6-6 | 316280 | 735 | 462601 | 428145 | 430183 | 94019 |
| 7-7 | 59241 | 626 | 341414 | 339319 | 328748 | 21026 |
| 8-8 | 70952 | 555 | 274464 | 287173 | 261233 | 12164 |
| 9-9 | 39432 | 480 | 225395 | 233385 | 212285 | 2584 |
| 10-19 | 490919 | 3340 | 1073029 | 1334970 | 989297 | 4512 |
| 20-29 | 477096 | 1695 | 372922 | 584914 | 333453 | 105 |
| 30-39 | 433028 | 1124 | 184720 | 312555 | 164837 | 17 |
| 40-49 | 468415 | 862 | 109811 | 175099 | 98482 | 7 |
| 50-59 | 326108 | 655 | 72882 | 108358 | 65772 | 6 |
| 60-69 | 223578 | 483 | 51244 | 72750 | 46811 | 3 |
| 70-79 | 159799 | 451 | 37803 | 49486 | 34721 | 5 |
| Cardinality | S | P | O | SP | PO | OS |
| 80-89 | 115875 | 350 | 28151 | 35472 | 26518 | 3 |
| 90-99 | 89577 | 351 | 22036 | 27210 | 20579 | 0 |
| 100-199 | 272325 | 1831 | 95504 | 97731 | 90062 | 13 |
| 200-299 | 40821 | 949 | 29111 | 20774 | 27622 | 7 |
| 300-399 | 12997 | 593 | 13227 | 7053 | 12645 | 1 |
| 400-499 | 5664 | 392 | 7787 | 3153 | 7322 | 0 |
| 500-599 | 3022 | 303 | 5033 | 1933 | 4602 | 0 |
| 600-699 | 1598 | 306 | 3483 | 1068 | 3184 | 0 |
| 700-799 | 930 | 245 | 2427 | 630 | 2256 | 0 |
| 800-899 | 688 | 156 | 1916 | 441 | 1837 | 0 |
| 900-999 | 469 | 136 | 1499 | 325 | 1418 | 0 |
| 1000-1099 | 4 | 3 | 8 | 1 | 10 | 0 |
| 1000-1999 | 1463 | 909 | 6001 | 1081 | 5795 | 0 |
| 2000-2999 | 147 | 383 | 1727 | 113 | 1768 | 0 |
| 3000-3999 | 38 | 211 | 875 | 34 | 812 | 0 |
| 4000-4999 | 10 | 126 | 486 | 9 | 460 | 0 |
| 5000-5999 | 10 | 89 | 320 | 10 | 298 | 0 |
| Cardinality | S | P | O | SP | PO | OS |
| 6000-6999 | 1 | 81 | 228 | 1 | 185 | 0 |
| 7000-7999 | 1 | 49 | 154 | 1 | 119 | 0 |
| 8000-8999 | 0 | 64 | 137 | 0 | 113 | 0 |
| 9000-9999 | 0 | 47 | 81 | 0 | 69 | 0 |
| 10000-19999 | 0 | 273 | 353 | 0 | 303 | 0 |
| 20000-29999 | 0 | 111 | 140 | 0 | 94 | 0 |
| 30000-39999 | 0 | 80 | 61 | 0 | 45 | 0 |
| 40000-49999 | 0 | 35 | 41 | 0 | 20 | 0 |
| 50000-59999 | 0 | 29 | 13 | 0 | 14 | 0 |
| 60000-69999 | 0 | 17 | 15 | 0 | 18 | 0 |
| 70000-79999 | 0 | 17 | 11 | 0 | 5 | 0 |
| 80000-89999 | 0 | 17 | 8 | 0 | 1 | 0 |
| 90000-99999 | 0 | 7 | 10 | 0 | 3 | 0 |
| 100000-199999 | 0 | 61 | 24 | 0 | 14 | 0 |
| 200000-299999 | 0 | 13 | 2 | 0 | 0 | 0 |
| 300000-399999 | 0 | 3 | 3 | 0 | 4 | 0 |
| 400000-499999 | 0 | 1 | 3 | 0 | 3 | 0 |
| Cardinality | S | P | O | SP | PO | OS |
| 500000-599999 | 0 | 7 | 3 | 0 | 2 | 0 |
| 600000-699999 | 0 | 1 | 0 | 0 | 0 | 0 |
| 700000-799999 | 0 | 1 | 0 | 0 | 0 | 0 |
| 800000-899999 | 0 | 2 | 0 | 0 | 0 | 0 |
| 1000000-1999999 | 0 | 4 | 1 | 0 | 1 | 0 |
| 2000000-2999999 | 0 | 1 | 0 | 0 | 0 | 0 |
| 3000000-3999999 | 0 | 2 | 0 | 0 | 0 | 0 |
| 4000000-4999999 | 0 | 1 | 0 | 0 | 0 | 0 |
| 5000000-5999999 | 0 | 1 | 0 | 0 | 0 | 0 |
| 6000000-6999999 | 0 | 1 | 0 | 0 | 0 | 0 |
| 7000000-7999999 | 0 | 4 | 1 | 0 | 1 | 0 |
| 9000000-9999999 | 0 | 2 | 0 | 0 | 0 | 0 |
| 10000000-19999999 | 0 | 1 | 0 | 0 | 0 | 0 |
| 90000000-99999999 | 0 | 1 | 0 | 0 | 0 | 0 |
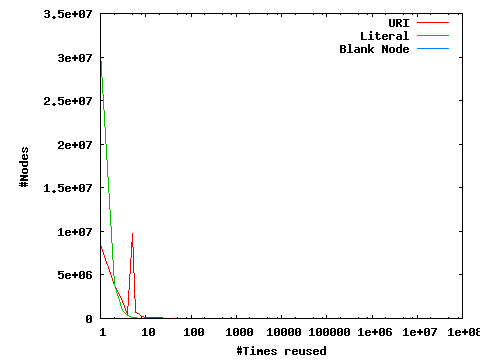
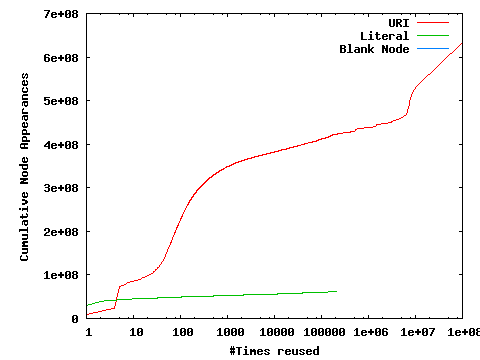
These graphs illustrate the number of times nodes are reused across all elements of a triple. Graph 1 shows the number of nodes that have been reused a given number of times: if 10 nodes appear 100 times, a point will be plotted at (x=100,y=10). Graph 2 is again more complex: if 10 nodes appear 100 times, and 2 nodes appear 101 times, points will be plotted at (x=100,y=1000), and (x=101,y=1202). This aids in visualising what proportion of the dataset is made up of heavily reused nodes vs rarely reused nodes.
Data Files: URI Literal B-Node
| #Times reused | URI | Literal | Blank Node |
|---|---|---|---|
| Total | 30218224 | 36245030 | 0 |
| 1-1 | 8454355 | 30514732 | 0 |
| 2-2 | 3738198 | 3915583 | 0 |
| 3-3 | 1920471 | 934156 | 0 |
| 4-4 | 412706 | 322932 | 0 |
| 5-5 | 9810425 | 145747 | 0 |
| 6-6 | 739064 | 95783 | 0 |
| 7-7 | 518101 | 50710 | 0 |
| 8-8 | 253417 | 36805 | 0 |
| 9-9 | 203877 | 25931 | 0 |
| 10-19 | 887449 | 104545 | 0 |
| 20-29 | 553293 | 34578 | 0 |
| 30-39 | 473485 | 18380 | 0 |
| 40-49 | 451994 | 10673 | 0 |
| 50-59 | 399317 | 7045 | 0 |
| 60-69 | 276840 | 4696 | 0 |
| 70-79 | 207441 | 3370 | 0 |
| #Times reused | URI | Literal | Blank Node |
| 80-89 | 157333 | 2250 | 0 |
| 90-99 | 120778 | 1829 | 0 |
| 100-199 | 446536 | 7928 | 0 |
| 200-299 | 92856 | 2361 | 0 |
| 300-399 | 36324 | 1109 | 0 |
| 400-499 | 18705 | 768 | 0 |
| 500-599 | 10831 | 581 | 0 |
| 600-699 | 7075 | 425 | 0 |
| 700-799 | 4826 | 283 | 0 |
| 800-899 | 3497 | 216 | 0 |
| 900-999 | 2591 | 186 | 0 |
| 1000-1099 | 26 | 0 | 0 |
| 1000-1999 | 9910 | 692 | 0 |
| 2000-2999 | 2324 | 244 | 0 |
| 3000-3999 | 1108 | 123 | 0 |
| 4000-4999 | 642 | 65 | 0 |
| 5000-5999 | 384 | 40 | 0 |
| #Times reused | URI | Literal | Blank Node |
| 6000-6999 | 302 | 39 | 0 |
| 7000-7999 | 194 | 26 | 0 |
| 8000-8999 | 192 | 23 | 0 |
| 9000-9999 | 113 | 17 | 0 |
| 10000-19999 | 582 | 62 | 0 |
| 20000-29999 | 213 | 37 | 0 |
| 30000-39999 | 124 | 21 | 0 |
| 40000-49999 | 56 | 17 | 0 |
| 50000-59999 | 39 | 5 | 0 |
| 60000-69999 | 27 | 6 | 0 |
| 70000-79999 | 24 | 4 | 0 |
| 80000-89999 | 25 | 0 | 0 |
| 90000-99999 | 15 | 2 | 0 |
| 100000-199999 | 81 | 4 | 0 |
| 200000-299999 | 14 | 1 | 0 |
| 300000-399999 | 6 | 0 | 0 |
| 400000-499999 | 4 | 0 | 0 |
| #Times reused | URI | Literal | Blank Node |
| 500000-599999 | 10 | 0 | 0 |
| 600000-699999 | 1 | 0 | 0 |
| 700000-799999 | 1 | 0 | 0 |
| 800000-899999 | 2 | 0 | 0 |
| 1000000-1999999 | 5 | 0 | 0 |
| 2000000-2999999 | 1 | 0 | 0 |
| 3000000-3999999 | 2 | 0 | 0 |
| 4000000-4999999 | 1 | 0 | 0 |
| 5000000-5999999 | 1 | 0 | 0 |
| 6000000-6999999 | 1 | 0 | 0 |
| 7000000-7999999 | 5 | 0 | 0 |
| 9000000-9999999 | 2 | 0 | 0 |
| 10000000-19999999 | 1 | 0 | 0 |
| 90000000-99999999 | 1 | 0 | 0 |
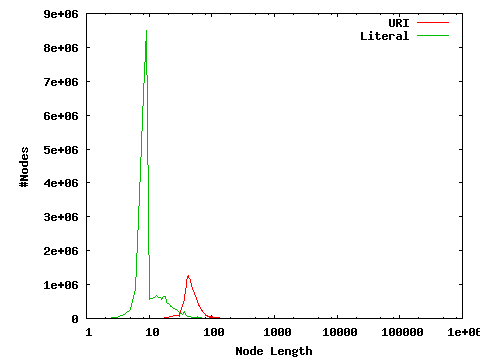
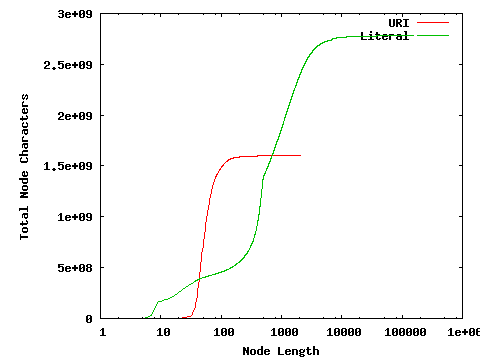
These graphs illustrate the length in bytes of nodes. In both cases, even if a Node is reused many times, it is only considered once in these graphs. Graph 1 shows the number of nodes that have a given length: if 10 nodes have a length of 100 bytes, a point will be plotted at (x=100,y=10). Graph 2 is again more complex, plotting the cumulative space used: if there are 10 nodes of length 100 bytes, and 2 nodes of length 110 bytes, points will be plotted at (x=100,y=1000), and (x=110,y=1220). This aids in visualising what proportion of space is taken up by nodes of a given size.
| Node Length | URI | Literal |
|---|---|---|
| Total | 30218224 | 36245029 |
| 1-1 | 72 | 23 |
| 2-2 | 1855 | 2841 |
| 3-3 | 7132 | 38834 |
| 4-4 | 9682 | 125933 |
| 5-5 | 10573 | 268445 |
| 6-6 | 9322 | 889580 |
| 7-7 | 9103 | 3650586 |
| 8-8 | 7736 | 6631679 |
| 9-9 | 6853 | 8503520 |
| 10-19 | 70046 | 6049375 |
| 20-29 | 667438 | 3127136 |
| 30-39 | 4469975 | 1493856 |
| 40-49 | 11058969 | 533083 |
| 50-59 | 6582427 | 272552 |
| 60-69 | 3431096 | 203984 |
| 70-79 | 1678006 | 128919 |
| Node Length | URI | Literal |
| 80-89 | 775803 | 115052 |
| 90-99 | 467434 | 95416 |
| 100-199 | 910083 | 688230 |
| 200-299 | 38465 | 541664 |
| 300-399 | 4073 | 679607 |
| 400-499 | 1011 | 1019534 |
| 500-599 | 362 | 201570 |
| 600-699 | 276 | 157567 |
| 700-799 | 179 | 128169 |
| 800-899 | 80 | 103969 |
| 900-999 | 53 | 85415 |
| 1000-1099 | 1 | 778 |
| 1000-1999 | 118 | 379846 |
| 2000-2999 | 1 | 87226 |
| 3000-3999 | 0 | 23927 |
| 4000-4999 | 0 | 7901 |
| 5000-5999 | 0 | 3145 |
| Node Length | URI | Literal |
| 6000-6999 | 0 | 2407 |
| 7000-7999 | 0 | 1471 |
| 8000-8999 | 0 | 533 |
| 9000-9999 | 0 | 326 |
| 10000-19999 | 0 | 749 |
| 20000-29999 | 0 | 115 |
| 30000-39999 | 0 | 34 |
| 40000-49999 | 0 | 17 |
| 50000-59999 | 0 | 3 |
| 60000-69999 | 0 | 6 |
| 70000-79999 | 0 | 3 |
| 90000-99999 | 0 | 2 |
| 100000-199999 | 0 | 1 |