Triple Count: 161489
URI Count: 30338
Average URI length: 48.37, Standard Deviation: 11.33
Average URI reuse: 13.87
Appeared as (ignoring literals):
S only: 9963
P only: 87
S and P: 0
O only: 28
O and S: 20186
P and O: 74
S, P and O: 0
O including literals: 22311
Literal Count: 22283
Average literal length: 42.96, Standard Deviation: 131.07
Average literal reuse: 2.86
Blank Node Count: 0
Average Blank Node reuse: 0.00
Node appearances as S, P, O, SP, PO, OS
Aggregate node reuse
Node lengths
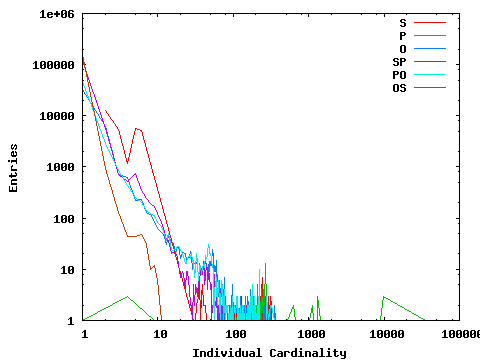
Graph 1 shows the number of times nodes (or node pairs) of a given cardinality appear. So, if there are 200,000 nodes that appear as a Subject on three occasions, then 200,000 will be plotted at an x-position of 3 on the graph.
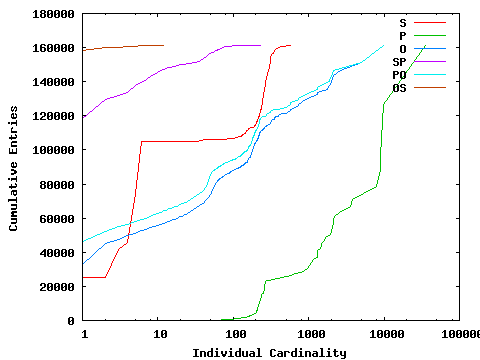
Graph 2 is more complex: it shows the cumulative entries to give a more readable graph. In this graph, if we have 100,000 nodes that appear as a Subject only once, and 100,000 nodes that appear as a Subject twice, then we plot points at (x=1,y=100,000), and (x=2,y=300,000). Thus, if a given Subject exists many times relative to the size of the dataset, it will cause a pronounced upward tick in the graph. This second graph is useful for showing the proportion of an index over S (or P, or SP, etc) that will be made up of small entries, vs large ones with repeating elements.


| Cardinality | S | P | O | SP | PO | OS |
|---|---|---|---|---|---|---|
| Total | 30149 | 161 | 42571 | 127531 | 52745 | 159346 |
| 1-1 | 0 | 1 | 33095 | 118222 | 46517 | 158100 |
| 2-2 | 12476 | 0 | 6125 | 5700 | 2878 | 923 |
| 3-3 | 5463 | 0 | 729 | 708 | 851 | 128 |
| 4-4 | 1152 | 3 | 633 | 516 | 426 | 44 |
| 5-5 | 5734 | 0 | 218 | 746 | 254 | 44 |
| 6-6 | 5058 | 0 | 234 | 340 | 198 | 47 |
| 7-7 | 0 | 0 | 131 | 240 | 144 | 30 |
| 8-8 | 0 | 0 | 120 | 196 | 125 | 10 |
| 9-9 | 0 | 1 | 82 | 168 | 112 | 12 |
| 10-19 | 0 | 1 | 380 | 429 | 419 | 8 |
| 20-29 | 0 | 1 | 176 | 55 | 174 | 0 |
| 30-39 | 22 | 0 | 111 | 59 | 114 | 0 |
| 40-49 | 7 | 0 | 111 | 77 | 186 | 0 |
| 50-59 | 0 | 1 | 135 | 33 | 91 | 0 |
| 60-69 | 2 | 2 | 47 | 21 | 33 | 0 |
| 70-79 | 3 | 1 | 26 | 14 | 19 | 0 |
| Cardinality | S | P | O | SP | PO | OS |
| 80-89 | 0 | 1 | 11 | 2 | 9 | 0 |
| 90-99 | 5 | 3 | 14 | 1 | 9 | 0 |
| 100-199 | 54 | 24 | 107 | 3 | 110 | 0 |
| 200-299 | 133 | 80 | 43 | 1 | 44 | 0 |
| 300-399 | 36 | 3 | 17 | 0 | 8 | 0 |
| 400-499 | 3 | 2 | 2 | 0 | 1 | 0 |
| 500-599 | 1 | 1 | 5 | 0 | 6 | 0 |
| 600-699 | 0 | 3 | 1 | 0 | 1 | 0 |
| 700-799 | 0 | 0 | 4 | 0 | 3 | 0 |
| 800-899 | 0 | 2 | 2 | 0 | 2 | 0 |
| 900-999 | 0 | 2 | 0 | 0 | 0 | 0 |
| 1000-1999 | 0 | 14 | 6 | 0 | 7 | 0 |
| 2000-2999 | 0 | 6 | 4 | 0 | 2 | 0 |
| 3000-3999 | 0 | 2 | 0 | 0 | 0 | 0 |
| 5000-5999 | 0 | 0 | 1 | 0 | 1 | 0 |
| 7000-7999 | 0 | 1 | 0 | 0 | 0 | 0 |
| 8000-8999 | 0 | 1 | 0 | 0 | 0 | 0 |
| Cardinality | S | P | O | SP | PO | OS |
| 9000-9999 | 0 | 4 | 1 | 0 | 1 | 0 |
| 30000-39999 | 0 | 1 | 0 | 0 | 0 | 0 |
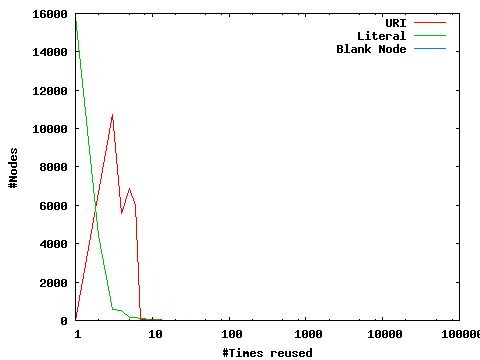
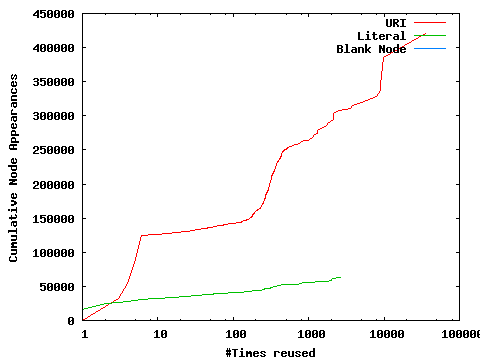
These graphs illustrate the number of times nodes are reused across all elements of a triple. Graph 1 shows the number of nodes that have been reused a given number of times: if 10 nodes appear 100 times, a point will be plotted at (x=100,y=10). Graph 2 is again more complex: if 10 nodes appear 100 times, and 2 nodes appear 101 times, points will be plotted at (x=100,y=1000), and (x=101,y=1202). This aids in visualising what proportion of the dataset is made up of heavily reused nodes vs rarely reused nodes.
Data Files: URI Literal B-Node
| #Times reused | URI | Literal | Blank Node |
|---|---|---|---|
| Total | 30338 | 22283 | 0 |
| 1-1 | 1 | 15830 | 0 |
| 2-2 | 0 | 4405 | 0 |
| 3-3 | 10723 | 562 | 0 |
| 4-4 | 5562 | 542 | 0 |
| 5-5 | 6883 | 163 | 0 |
| 6-6 | 5991 | 173 | 0 |
| 7-7 | 53 | 80 | 0 |
| 8-8 | 55 | 83 | 0 |
| 9-9 | 52 | 42 | 0 |
| 10-19 | 248 | 181 | 0 |
| 20-29 | 106 | 68 | 0 |
| 30-39 | 68 | 39 | 0 |
| 40-49 | 40 | 23 | 0 |
| 50-59 | 40 | 15 | 0 |
| 60-69 | 23 | 10 | 0 |
| 70-79 | 15 | 6 | 0 |
| #Times reused | URI | Literal | Blank Node |
| 80-89 | 10 | 0 | 0 |
| 90-99 | 8 | 3 | 0 |
| 100-199 | 110 | 23 | 0 |
| 200-299 | 142 | 11 | 0 |
| 300-399 | 109 | 14 | 0 |
| 400-499 | 39 | 2 | 0 |
| 500-599 | 10 | 1 | 0 |
| 600-699 | 4 | 0 | 0 |
| 700-799 | 4 | 2 | 0 |
| 800-899 | 3 | 1 | 0 |
| 1000-1999 | 21 | 1 | 0 |
| 2000-2999 | 7 | 3 | 0 |
| 3000-3999 | 2 | 0 | 0 |
| 5000-5999 | 1 | 0 | 0 |
| 7000-7999 | 1 | 0 | 0 |
| 8000-8999 | 1 | 0 | 0 |
| 9000-9999 | 5 | 0 | 0 |
| #Times reused | URI | Literal | Blank Node |
| 30000-39999 | 1 | 0 | 0 |
These graphs illustrate the length in bytes of nodes. In both cases, even if a Node is reused many times, it is only considered once in these graphs. Graph 1 shows the number of nodes that have a given length: if 10 nodes have a length of 100 bytes, a point will be plotted at (x=100,y=10). Graph 2 is again more complex, plotting the cumulative space used: if there are 10 nodes of length 100 bytes, and 2 nodes of length 110 bytes, points will be plotted at (x=100,y=1000), and (x=110,y=1220). This aids in visualising what proportion of space is taken up by nodes of a given size.
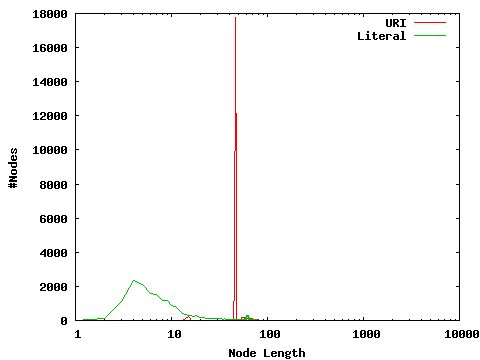
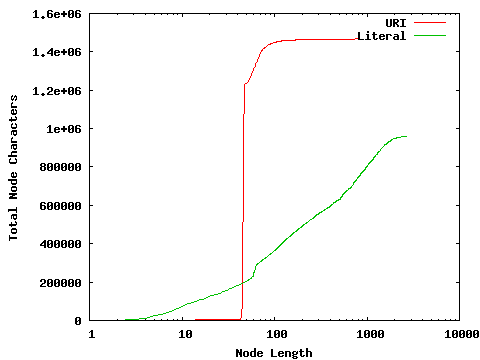
| Node Length | URI | Literal |
|---|---|---|
| Total | 30338 | 22282 |
| 1-1 | 0 | 11 |
| 2-2 | 0 | 116 |
| 3-3 | 0 | 1107 |
| 4-4 | 0 | 2344 |
| 5-5 | 0 | 2119 |
| 6-6 | 0 | 1586 |
| 7-7 | 0 | 1497 |
| 8-8 | 0 | 1170 |
| 9-9 | 0 | 1162 |
| 10-19 | 215 | 4397 |
| 20-29 | 0 | 1287 |
| 30-39 | 0 | 837 |
| 40-49 | 26689 | 503 |
| 50-59 | 1186 | 506 |
| 60-69 | 1299 | 1162 |
| 70-79 | 529 | 292 |
| Node Length | URI | Literal |
| 80-89 | 195 | 219 |
| 90-99 | 86 | 201 |
| 100-199 | 129 | 949 |
| 200-299 | 5 | 265 |
| 300-399 | 1 | 112 |
| 400-499 | 1 | 81 |
| 500-599 | 1 | 82 |
| 600-699 | 0 | 44 |
| 700-799 | 2 | 54 |
| 800-899 | 0 | 34 |
| 900-999 | 0 | 28 |
| 1000-1099 | 0 | 2 |
| 1000-1999 | 0 | 111 |
| 2000-2999 | 0 | 4 |