Triple Count: 105316107
URI Count: 15521808
Average URI length: 88.60, Standard Deviation: 2.39
Average URI reuse: 16.84
Appeared as (ignoring literals):
S only: 9000131
P only: 40
S and P: 0
O only: 6009244
O and S: 512393
P and O: 0
S, P and O: 0
O including literals: 15176146
Literal Count: 9166902
Average literal length: 480.92, Standard Deviation: 602.00
Average literal reuse: 5.94
Blank Node Count: 0
Average Blank Node reuse: 0.00
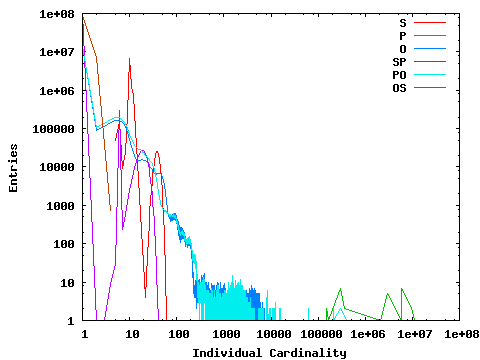
Node appearances as S, P, O, SP, PO, OS
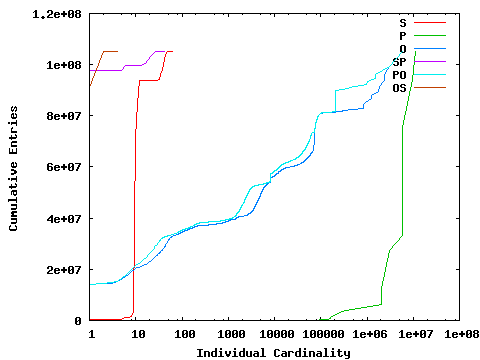
Aggregate node reuse
Node lengths
Graph 1 shows the number of times nodes (or node pairs) of a given cardinality appear. So, if there are 200,000 nodes that appear as a Subject on three occasions, then 200,000 will be plotted at an x-position of 3 on the graph.
Graph 2 is more complex: it shows the cumulative entries to give a more readable graph. In this graph, if we have 100,000 nodes that appear as a Subject only once, and 100,000 nodes that appear as a Subject twice, then we plot points at (x=1,y=100,000), and (x=2,y=300,000). Thus, if a given Subject exists many times relative to the size of the dataset, it will cause a pronounced upward tick in the graph. This second graph is useful for showing the proportion of an index over S (or P, or SP, etc) that will be made up of small entries, vs large ones with repeating elements.
| Cardinality | S | P | O | SP | PO | OS |
|---|---|---|---|---|---|---|
| Total | 9512524 | 40 | 15688539 | 98287072 | 16005635 | 98171864 |
| 1-1 | 0 | 0 | 14108025 | 97687072 | 14117438 | 91067436 |
| 2-2 | 0 | 0 | 89932 | 1 | 107166 | 7065345 |
| 3-3 | 0 | 0 | 113309 | 1 | 135169 | 38351 |
| 4-4 | 0 | 0 | 144720 | 9 | 168667 | 732 |
| 5-5 | 47885 | 0 | 167569 | 28 | 191924 | 0 |
| 6-6 | 155713 | 0 | 167048 | 300099 | 190313 | 0 |
| 7-7 | 8926 | 0 | 144931 | 242 | 166330 | 0 |
| 8-8 | 24298 | 0 | 112347 | 595 | 132968 | 0 |
| 9-9 | 226774 | 0 | 79156 | 1252 | 98468 | 0 |
| 10-19 | 8748928 | 0 | 218680 | 153740 | 371300 | 0 |
| 20-29 | 4917 | 0 | 123602 | 139441 | 175720 | 0 |
| 30-39 | 163094 | 0 | 69843 | 4586 | 75128 | 0 |
| 40-49 | 127587 | 0 | 64981 | 6 | 15445 | 0 |
| 50-59 | 4397 | 0 | 34901 | 0 | 7487 | 0 |
| 60-69 | 5 | 0 | 8460 | 0 | 6232 | 0 |
| 70-79 | 0 | 0 | 4568 | 0 | 5447 | 0 |
| Cardinality | S | P | O | SP | PO | OS |
| 80-89 | 0 | 0 | 5051 | 0 | 5346 | 0 |
| 90-99 | 0 | 0 | 4995 | 0 | 4900 | 0 |
| 100-199 | 0 | 0 | 16474 | 0 | 16758 | 0 |
| 200-299 | 0 | 0 | 1669 | 0 | 3429 | 0 |
| 300-399 | 0 | 0 | 805 | 0 | 630 | 0 |
| 400-499 | 0 | 0 | 430 | 0 | 275 | 0 |
| 500-599 | 0 | 0 | 329 | 0 | 222 | 0 |
| 600-699 | 0 | 0 | 303 | 0 | 201 | 0 |
| 700-799 | 0 | 0 | 399 | 0 | 296 | 0 |
| 800-899 | 0 | 0 | 287 | 0 | 181 | 0 |
| 900-999 | 0 | 0 | 338 | 0 | 201 | 0 |
| 1000-1099 | 0 | 0 | 6 | 0 | 1 | 0 |
| 1000-1999 | 0 | 0 | 1334 | 0 | 3478 | 0 |
| 2000-2999 | 0 | 1 | 531 | 0 | 2638 | 0 |
| 3000-3999 | 0 | 0 | 913 | 0 | 448 | 0 |
| 4000-4999 | 0 | 0 | 851 | 0 | 64 | 0 |
| 5000-5999 | 0 | 0 | 555 | 0 | 68 | 0 |
| Cardinality | S | P | O | SP | PO | OS |
| 6000-6999 | 0 | 0 | 215 | 0 | 66 | 0 |
| 7000-7999 | 0 | 0 | 78 | 0 | 50 | 0 |
| 8000-8999 | 0 | 1 | 232 | 0 | 419 | 0 |
| 9000-9999 | 0 | 0 | 62 | 0 | 64 | 0 |
| 10000-19999 | 0 | 0 | 254 | 0 | 283 | 0 |
| 20000-29999 | 0 | 0 | 31 | 0 | 59 | 0 |
| 30000-39999 | 0 | 0 | 30 | 0 | 58 | 0 |
| 40000-49999 | 0 | 0 | 33 | 0 | 62 | 0 |
| 50000-59999 | 0 | 1 | 29 | 0 | 57 | 0 |
| 60000-69999 | 0 | 1 | 32 | 0 | 30 | 0 |
| 70000-79999 | 0 | 0 | 145 | 0 | 56 | 0 |
| 80000-89999 | 0 | 0 | 29 | 0 | 29 | 0 |
| 90000-99999 | 0 | 0 | 8 | 0 | 8 | 0 |
| 100000-199999 | 0 | 7 | 5 | 0 | 6 | 0 |
| 200000-299999 | 0 | 0 | 0 | 0 | 40 | 0 |
| 300000-399999 | 0 | 9 | 2 | 0 | 3 | 0 |
| 400000-499999 | 0 | 0 | 0 | 0 | 1 | 0 |
| Cardinality | S | P | O | SP | PO | OS |
| 800000-899999 | 0 | 0 | 3 | 0 | 0 | 0 |
| 900000-999999 | 0 | 0 | 1 | 0 | 1 | 0 |
| 1000000-1999999 | 0 | 0 | 4 | 0 | 3 | 0 |
| 2000000-2999999 | 0 | 4 | 2 | 0 | 0 | 0 |
| 3000000-3999999 | 0 | 5 | 1 | 0 | 1 | 0 |
| 5000000-5999999 | 0 | 1 | 0 | 0 | 0 | 0 |
| 6000000-6999999 | 0 | 7 | 1 | 0 | 1 | 0 |
| 9000000-9999999 | 0 | 2 | 0 | 0 | 0 | 0 |
| 10000000-19999999 | 0 | 1 | 0 | 0 | 0 | 0 |
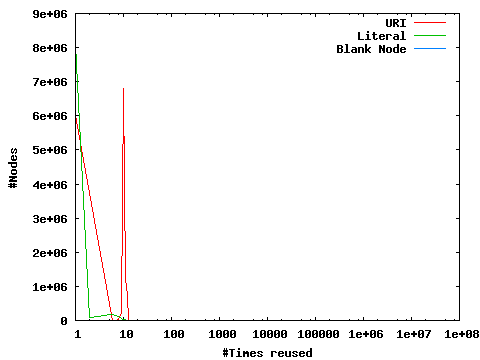
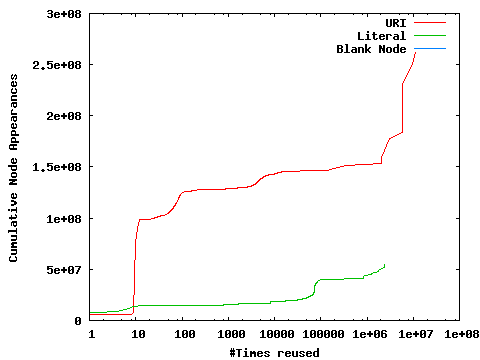
These graphs illustrate the number of times nodes are reused across all elements of a triple. Graph 1 shows the number of nodes that have been reused a given number of times: if 10 nodes appear 100 times, a point will be plotted at (x=100,y=10). Graph 2 is again more complex: if 10 nodes appear 100 times, and 2 nodes appear 101 times, points will be plotted at (x=100,y=1000), and (x=101,y=1202). This aids in visualising what proportion of the dataset is made up of heavily reused nodes vs rarely reused nodes.
Data Files: URI Literal B-Node
| #Times reused | URI | Literal | Blank Node |
|---|---|---|---|
| Total | 15521808 | 9166902 | 0 |
| 1-1 | 6008926 | 8098811 | 0 |
| 2-2 | 0 | 89279 | 0 |
| 3-3 | 0 | 111953 | 0 |
| 4-4 | 0 | 142267 | 0 |
| 5-5 | 0 | 163621 | 0 |
| 6-6 | 117 | 161367 | 0 |
| 7-7 | 209 | 137660 | 0 |
| 8-8 | 24588 | 103696 | 0 |
| 9-9 | 227227 | 69397 | 0 |
| 10-19 | 8777383 | 83613 | 0 |
| 20-29 | 87206 | 5 | 0 |
| 30-39 | 47212 | 1 | 0 |
| 40-49 | 43207 | 0 | 0 |
| 50-59 | 64238 | 1 | 0 |
| 60-69 | 57553 | 0 | 0 |
| 70-79 | 61151 | 0 | 0 |
| #Times reused | URI | Literal | Blank Node |
| 80-89 | 59648 | 1 | 0 |
| 90-99 | 33196 | 3 | 0 |
| 100-199 | 22280 | 2460 | 0 |
| 200-299 | 1847 | 241 | 0 |
| 300-399 | 603 | 194 | 0 |
| 400-499 | 281 | 179 | 0 |
| 500-599 | 169 | 157 | 0 |
| 600-699 | 144 | 155 | 0 |
| 700-799 | 239 | 164 | 0 |
| 800-899 | 102 | 189 | 0 |
| 900-999 | 91 | 248 | 0 |
| 1000-1099 | 1 | 5 | 0 |
| 1000-1999 | 851 | 487 | 0 |
| 2000-2999 | 495 | 33 | 0 |
| 3000-3999 | 871 | 31 | 0 |
| 4000-4999 | 832 | 27 | 0 |
| 5000-5999 | 534 | 24 | 0 |
| #Times reused | URI | Literal | Blank Node |
| 6000-6999 | 196 | 21 | 0 |
| 7000-7999 | 58 | 22 | 0 |
| 8000-8999 | 41 | 192 | 0 |
| 9000-9999 | 44 | 18 | 0 |
| 10000-19999 | 214 | 40 | 0 |
| 20000-29999 | 3 | 28 | 0 |
| 30000-39999 | 2 | 28 | 0 |
| 40000-49999 | 5 | 28 | 0 |
| 50000-59999 | 1 | 29 | 0 |
| 60000-69999 | 2 | 31 | 0 |
| 70000-79999 | 0 | 145 | 0 |
| 80000-89999 | 0 | 29 | 0 |
| 90000-99999 | 0 | 8 | 0 |
| 100000-199999 | 8 | 4 | 0 |
| 300000-399999 | 11 | 0 | 0 |
| 800000-899999 | 0 | 3 | 0 |
| 900000-999999 | 0 | 1 | 0 |
| #Times reused | URI | Literal | Blank Node |
| 1000000-1999999 | 0 | 4 | 0 |
| 2000000-2999999 | 4 | 2 | 0 |
| 3000000-3999999 | 6 | 0 | 0 |
| 5000000-5999999 | 1 | 0 | 0 |
| 6000000-6999999 | 8 | 0 | 0 |
| 9000000-9999999 | 2 | 0 | 0 |
| 10000000-19999999 | 1 | 0 | 0 |
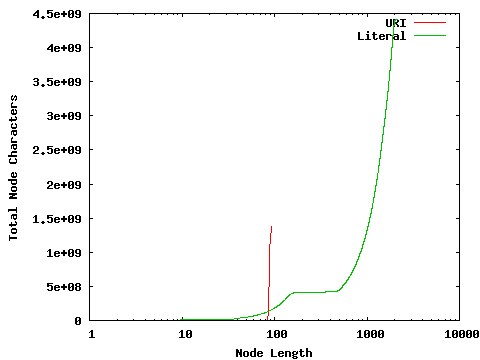
These graphs illustrate the length in bytes of nodes. In both cases, even if a Node is reused many times, it is only considered once in these graphs. Graph 1 shows the number of nodes that have a given length: if 10 nodes have a length of 100 bytes, a point will be plotted at (x=100,y=10). Graph 2 is again more complex, plotting the cumulative space used: if there are 10 nodes of length 100 bytes, and 2 nodes of length 110 bytes, points will be plotted at (x=100,y=1000), and (x=110,y=1220). This aids in visualising what proportion of space is taken up by nodes of a given size.
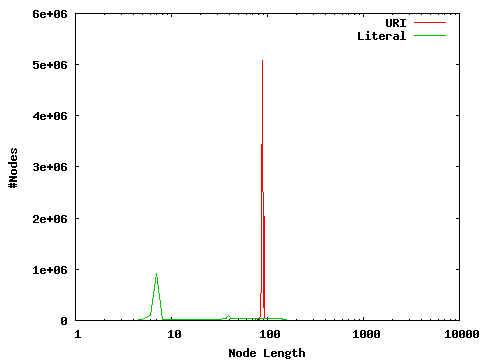
| Node Length | URI | Literal |
|---|---|---|
| Total | 15521808 | 9166902 |
| 1-1 | 0 | 9 |
| 2-2 | 0 | 158 |
| 3-3 | 0 | 1313 |
| 4-4 | 0 | 3454 |
| 5-5 | 0 | 14456 |
| 6-6 | 0 | 98540 |
| 7-7 | 0 | 910216 |
| 8-8 | 0 | 14058 |
| 9-9 | 0 | 12487 |
| 10-19 | 0 | 162114 |
| 20-29 | 8926 | 186390 |
| 30-39 | 9 | 414070 |
| 40-49 | 15 | 394886 |
| 50-59 | 0 | 354259 |
| 60-69 | 27 | 354039 |
| 70-79 | 49899 | 353692 |
| Node Length | URI | Literal |
| 80-89 | 12157805 | 353760 |
| 90-99 | 3305127 | 353651 |
| 100-199 | 0 | 1828516 |
| 200-299 | 0 | 19083 |
| 300-399 | 0 | 19185 |
| 400-499 | 0 | 54859 |
| 500-599 | 0 | 227806 |
| 600-699 | 0 | 232180 |
| 700-799 | 0 | 232177 |
| 800-899 | 0 | 232519 |
| 900-999 | 0 | 233272 |
| 1000-1099 | 0 | 2329 |
| 1000-1999 | 0 | 2095357 |
| 2000-2999 | 0 | 8067 |